- Getting started
- Project management
- Documents
- Working with Change Impact Analysis
- Create test cases
- Assigning test cases to requirements
- Cloning test cases
- Exporting test cases
- Linking test cases in Studio to Test Manager
- Delete test cases
- Manual test cases
- Importing manual test cases
- Document test cases with Task Capture
- Parameters
- Enabling governance at project level
- Disabling governance at project level
- Enabling governance at test-case level
- Disabling governance at test-case level
- Managing approvers for governed test cases
- Managing governed test cases in the In Work state
- Managing governeed test cases in the In Review state
- Managing governed objects in the Signed state
- Managing comments for governed test cases
- Applying filters and views
- Importing Orchestrator test sets
- Creating test sets
- Adding test cases to a test set
- Assigning default users in test set execution
- Enabling activity coverage
- Enabling Healing Agent
- Configuring test sets for specific execution folders and robots
- Overriding parameters
- Cloning test sets
- Exporting test sets
- Applying filters and views
- Accessibility testing for Test Cloud
- Searching with Autopilot
- Project operations and utilities
- Test Manager settings
- ALM tool integration
- API integration
- Coding Agents for Testing
- Troubleshooting
Test Manager user guide
Prerequisites
Feature availability depends on the cloud platform you use. For details, refer to the Test Manager feature availability page.
To enable reporting with Insights, follow these steps:
- Enable the Insights service on the same tenant as your Test Manager instance. You need an Automation Cloud Organization Administrator role to enable a service.
- From Test Manager, activate the Enable reporting with Insights tenant-level setting. You need a Test Manager Administrator tenant role to enable the integration with Insights. For more information about activating the setting, visit Tenant level settings.
Overview
Once you enable the Insights integration in your Test Manager tenant, you will be able to access analytics for all your testing projects within that tenant. Insights retrieves data from Test Manager, based on a specific data model, and presents it through the Test Manager Execution Report predefined dashboard. This dashboard provides an overview of all your test executions within your tenant.
Figure 1. Test Manager Execution Report dashboard
When you enable reporting with Insights, data from all Test Manager projects are uploaded to Insights. Therefore, all users with access to Insights will be able to generate reports on those projects, independent from their permissions in Test Manager.
Data model
Insights uses test case logs from Test Manager to generate the customizable dashboards. For more details on the data model used by Insights to generate the dashboards, check the Test Manager data model section.
In the Test Manager data model, test case logs contain two types of results: technical and functional. Usually these results are the same, unless a technical error appears during execution. Technical errors can include infrastructure disruptions, automation errors, or other non-functional triggers. In any of these scenarios, the technical results will be label the test as failed. Functional results are meant to only reflect the outcome of business verifications. Therefore they indicate no-result in case of errors because of the lack of a reliable outcome.
Building Insights dashboards based on custom fields
You can create Insights dashboards for Requirements and Test Sets, based on the custom fields associated with these data objects.
You can work with a maximum of 5 custom-field selectors and 5 dimensions.
- Log in to your platform and navigate to Insights.
- Go to Dashboards and add a dashboard.
- Open the dashboard and select Edit Dashboard.
- Hover the toolbar and select Add.
Figure 2. Add Insights dashboard
-
Select Visualization.
-
Under Test Manager, select the data object for which you want to create a dashboard. For example, let’s select Requirements.
-
Expand the data object category. For our example, expand Requirements. Note that you can have a maximum of 5 custom-field selectors (listed as Custom Field Selector 1 and so on, under Filter-Only Fields) and 5 dimensions (listed as Custom Field 1 and so on, under Dimensions). There is a 1:1 correspondence between the 5 custom-field selectors and the 5 custom-field dimensions. For example, Custom Field Selector 1 corresponds to Custom Field 1.
-
From Filter-Only Fields, select one or more custom-field selectors.
Figure 3. Custom field selection
- Expand the dropdown to see all the custom fields available in the tenant for your data object. The example below shows the custom fields available in the sample tenant, for requirements.
Figure 4. Custom field values
-
Select the custom field values for your custom-field selectors.
-
From Dimensions, select the custom fields. For example, select Custom Field 1, Custom Field 2, and Custom Field 3.
-
From Custom Field Filters, select the values you need. For example, select Name and Project Name.
-
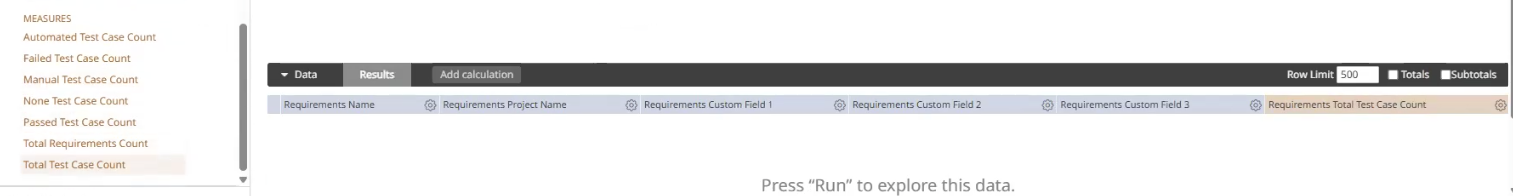
From Measures, select the values you need. For this example, select Total Test Case Count.
-
The values you selected are displayed on the right-hand side, in the workspace editor.
Figure 5. Measures

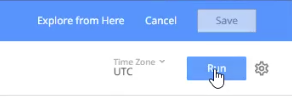
15. From the upper, right-hand side of the workspace, select Run.
Figure 6. Run dashboard

16. Wait for the data to load. The data can be visualized in multiple formats: table, graphs, or charts.
-
(Optional) Sort your data per column. For example, sort your data by priority.
-
From the upper, right-hand side of the workspace editor, select Save.
-
Select the pencil icon or select inside the table name to give your dashboard an official name. In our example, we named the dashboard “Custom Field for Requirement”.
-
Resize the table by dragging its edges.
-
From the toolbar menu, add a filter for your dashboard.
-
Select Filters > Add Filter.
-
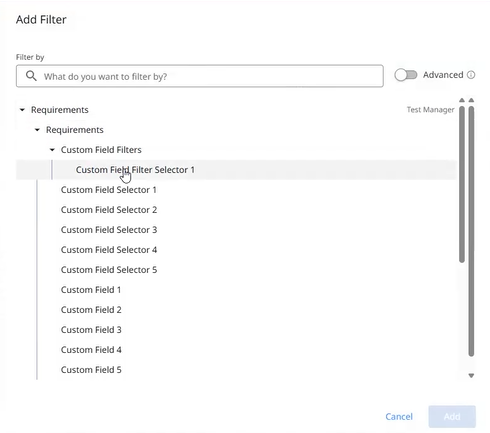
Add filters for your data object, in our case Requirements. Expand the data object (Requirements), expand Custom Field Filters and pick a selector (for example, Custom Field Filter Selector 1).
Figure 7. Filters

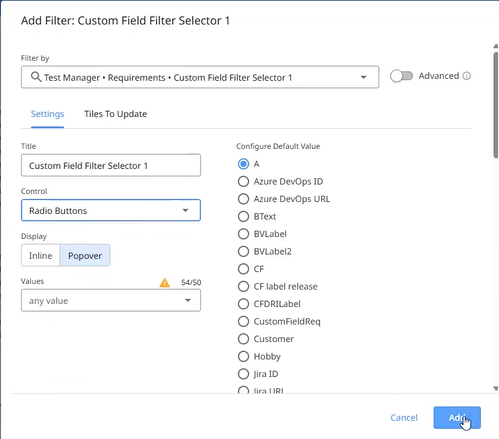
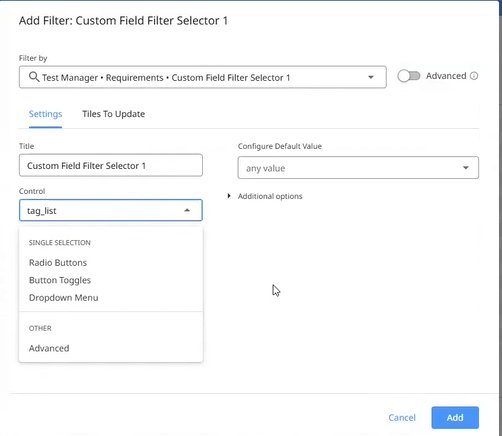
24. In the Add Filter dialog, continue configuring your filter (title, control, default value) and then select Add. For this example, we chose a radio button.
Figure 8. Add filter

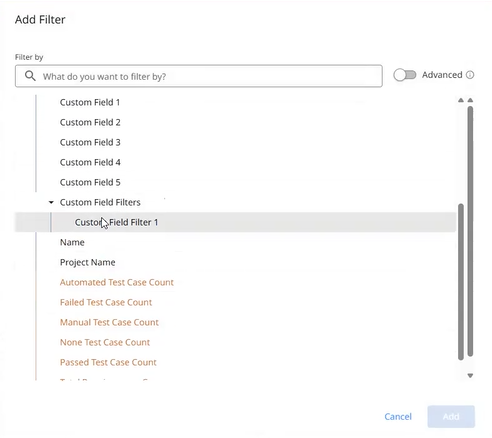
25. Expand the data object (Requirements) again and pick the selector value. For this example, we selected Custom Field Filters > Custom Field Filter 1.
Figure 9. Custom field filter

26. In the Add Filter dialog, continue the configuration (title, control, filter options) and select Add. For our example, we chose Advanced from the Control field, and is any value from the Configure Default Value field.
Figure 10. Filter configuration

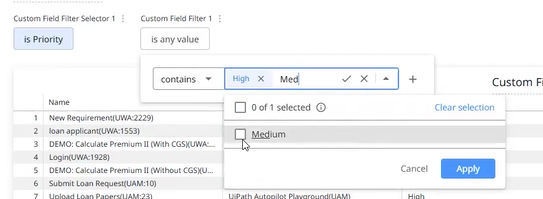
27. In your dashboard, check the filter you added. For this example, we added Custom Field Filter Selector 1 and Custom Field Filter 1. Below the first filter, expand the is menu, select a value (Priority), and select Apply. Below the second filter, expand the is any value menu, select an operator and a value (contains High or Medium), and select Apply.
Figure 11. Filter values

28. Select the Refresh button from the upper, right-hand corner of the workspace editor.
Result
The Insights dashboard is created with the selected custom fields, dimensions, and filters applied. The dashboard displays the filtered data for the selected test objects and is accessible from Insights.
Test Manager data model
Terms and concepts
The structure of the Test Manager data model is based on the following concepts:
| Concept | Description |
|---|---|
| Explore | The starting point for exploration. The data is surfaced via Explores, which you can think of as a general entity that corresponds to the fields within it. |
| View | A view represents a table of data, whether that table is native to your database or was created using Looker’s derived table functionality. Within each view are field definitions, each of which typically corresponds to a column in the underlying table or a calculation in Looker. |
| Dimension | As part of a View within the Explore, the Dimension is a groupable field and can be used to filter query results. It can be one of the following:
|
| Measure | As part of a View within the Explore, the Measure parameter declares a new measure (aggregation) and specifies a name for that measure. integer , string . |
Dimensions and measures
Feature availability depends on the cloud platform you use. For details, refer to the Test Manager feature availability page.
The Requirements, Test sets, and Test executions dimensions and measures are available in Test Manager only when delivered via Test Cloud.
Test case logs
The following tables describe the available dimensions and measures for test case logs.
| Dimension | Type | Description |
|---|---|---|
| Assignee Email | string | The email address of the user to which a test case was assigned to. |
| Automation Project Name | string | The name of the automation linked to the test case. |
| Due Date | date | The date when a manual test case was scheduled to have been executed. |
| Execution Start | date | The date when the test execution started. |
| Executed By | string | The username or robot name who executed the test. |
| Execution End | date | The date when the test execution ended. |
| Execution Type | string | The type of the execution:
|
| Host Machine Name | string | The name of the machine. |
| Project Name | string | The name of the Test Manager project. |
| Project Prefix | string | The prefix of the Test Manager project. |
| Reporting Date | date | The date when the test was executed. This is a date without time and also without time zone. |
| Result | string | The test case result: Passed, Failed, or None. |
| Robot Name | string | The name of the robot that executed the test. |
| Test Execution Name | string | The name of the test execution. |
Table 2. Test Case Logs measures
| Measures | Type | Description |
|---|---|---|
| Total Count | integer | The total number of test case logs. |
| Passed Count | string | The number of passed test case logs. |
| Failed Count (Technical) | integer | Technical results indicate results as failed when an exception occurs during execution. |
| No Result Count (Technical) | integer | Technical results indicate no results when an exception occurs during execution. |
| Duration in Seconds | integer | Total runtime in seconds. |
Requirements
The following tables describe the available dimensions and measures for requirements.
Table 3. Requirement dimensions
| Dimension | Type | Description |
|---|---|---|
| Project Name | string | A combination of the project name and project prefix aimed to make it unique and increase readability. |
| Name | string | A combination of the requirement key and its name, aimed to make it unique and increase readability. |
Table 4. Requirement measures
| Measure | Type | Description |
|---|---|---|
| Total test case count | integer | The number of test cases assigned to a requirement. |
| Automated test case count | integer | The number of automated test cases assigned to a requirement. |
| Manual test case count | integer | The number of manual test cases assigned to a requirement. |
| Passed test case count | integer | The number of test cases assigned to a requirement that have passed in the latest test run. |
| Failed test case count | integer | The number of test cases assigned to a requirement that have failed in the latest test run. |
| None test case count | integer | The number of test cases assigned to a requirement with no result in the latest test run. |
| Total requirements count | integer | The total number of requirements. |
Test sets
The following tables describe the available dimensions and measures for test sets.
For assigned test cases, the test set view contains information about static test assignments.
Table 5. Test set dimensions
| Dimension | Type | Description |
|---|---|---|
| Project Name | string | A combination of the project name and project prefix aimed to make it unique and increase readability. |
| Name | string | A combination of the project name and project prefix aimed to make it unique and increase readability. |
| Robot name | string | The name of the robot that executed the test set. |
| Source | string | The source of the test set: Orchestrator or Test Manager. |
Table 6. Test set measures
| Measure | Type | Description |
|---|---|---|
| Total test set count | integer | The number of test sets. |
| Automated test case count | string | The number of automated test cases in the test set. |
| Manual test case count | integer | Number of manual test cases in the test set. |
Test execution
The following tables describe the available dimensions and measures for test executions.
Table 7. Test executions dimensions
| Dimension | Type | Description |
|---|---|---|
| Project Name | string | A combination of project prefix and name to make it unique and increase readability. |
| Name | string | A combination of execution ID and name to make it unique and increase readability. |
| Test set name | string | A combination test set key and name to make it unique and increase readability. |
| Execution type | string | The execution type: Manual, Automated, None, or Mixed. |
| Source | string | The source of the execution: TestManager, Orchestrator, or Studio. |
Table 8. Test execution measures
| Measure | Type |
|---|---|
| Total test execution count | integer |
| Manual execution type count | integer |
| Automated execution type count | integer |
| Mixed execution type count | integer |
| Duration in seconds of test execution | integer |